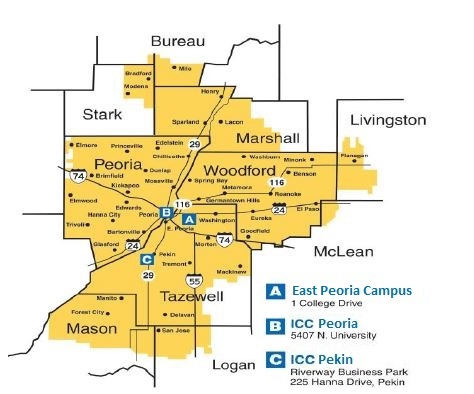
ICC serves all or parts of 10 Central Illinois counties: Peoria, Tazewell, Woodford, Bureau, Logan, Marshall, Livingston, McLean, Stark, and Mason.
District 514 Census Populations
Population
District #
Total
Males
Females
514
356,783
175,693
181,090
Source: Illinois Community College Board (ICCB) 2025 District Census Population
2023 Adult (16+) Population
District #
Total
Males
Females
514
285,322
138,994
146,328
Source: Illinois Community College Board (ICCB) 2025 District Census Population
Compared to Other Illinois Community College Districts
7th largest (2,322 square miles)
13th highest in assessed valuation ($7.8 billion)
21st highest in operating tax rate (per $100 of assessed value)
12th highest Fall headcount (7,578 Fall 2023, credit only)
Accreditation
Illinois Central College is accredited by the Higher Learning Commission of the North Central Association of Colleges & Schools, located at 230 S LaSalle St., Suite 7-500, Chicago, Illinois 60604, 312-263-0456.
Program & Class Information
1,377 classes offered in the Fall of 2025. The average class size is 15.
Associate in Arts: 42 programs of study**
Associate in Science: 17 programs of study
Associate in Applied Science: 39 programs of study
Occupational Certificates: 62 programs of study
**Includes Associates in Fine Arts
Enrollment
Fall Enrollment by Type of Degree/Certificate
Type
Fall 2023
Fall 2024
Fall 2025
Associate in Applied Science
16.1%
15.9%
15.2%
Associate in Arts
23.3%
20.8%
19.6%
Associate in Engineering Science
0.8%
0.8%
0.8%
Associate in General Education
11.9%
13.9%
14.6%
Associate in Science
8.5%
7.8%
8.0%
Associate in Fine Arts
0.2%
0.4%
Certificate
5.6%
6.1%
6.4%
Undeclared*
30.1%
30.5%
31.2%
Non-degree/Personal Improvement
3.7%
4.0%
3.8%
*Includes Dual Credit
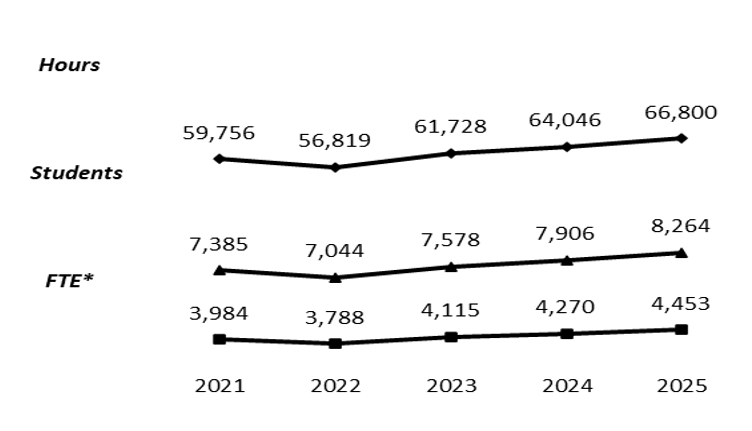
Fall Enrollment Trends (as of Census Day)
*Full-time equivalency
Fall Credit Hours by Location*
Fall 2023
Fall 2024
Fall 2025
East Peoria Campus
23,127
23,778
22,919
Peoria Campus
9,751
7,910
10,655
Pekin Campus
252
160
351
*Excludes Dual Credit and Online
Spring Enrollment Trends (as of Census Day)
Type
2020
2021
2022
2023
2024
Hours
67,589
57,623
53,382
53,101
56,678
Students
8,346
7,217
6,848
6,694
7,092
FTE*
4,506
3,842
3,559
3,540
3,779
*Full-time equivalency
Fall Student Profile (as of Census Day)
Race/Ethnicity
White
67.8%
Black/African American
13.3%
Hispanic (any race)
6.8%
Asian
6.5%
American Indian/Alaskan Native
2.2%
Native Hawaiian/Other Pacific Islander
2.7%
Non-resident Aliens
0.1%
Two or More
0.2%
Unknown
0.5%
Enrollment Status
Full-time
28.1%
Part-time
71.9%
Gender
Male
39%
Female
61%
Residency
In-District
84.8%
Out-of-District
11%
Out-of-State
1.4%
Foreign Stds
2.7%
Age
16 and under
10.2%
17-18
32.6%
19-24
31.3%
25-34
15%
35-44
6.8%
45-64
3.6%
65 and over
0.5%
Average Age
23
Fall Enrollment by Academic Organization
Academic Department
Number of Credit Hours
Percentage of Credit Hours
Agriculture & Industrial Technology
5,542
8.3%
Arts & Behavioral Science
12,393
18.6%
Business, Legal & Informational Systems
8,409
12.6%
College & Career Readiness
920
1.4%
Corporate & Community Education
71
0.1%
Health Careers
10,215
15.3%
Humanities
14,950
22.4%
Math, Science & Engineering
14,086
21.1%
Physical Education
215
0.2%
Annual Enrollment (unduplicated)
FY 2021 – 11,132
FY 2022 – 10,381
FY 2023 – 9,920
FY 2024 – 10,579
FY 2025 – 11,003
Fall Virtual Campus Enrollment
Class Type
Sections Offered
Credit Hours
Hybrid Classes
141
5,531.5
Online Anytime
355
19,505
Online Scheduled
21
712.5
Exclusively Online*
1,438
*Number of students
Financial Aid
Types and Average Amounts of Aid Received* (FY 2024)
Federal loans: $4,851
Institutional grants: $2,241
State/local grants: $2,198
Pell grants: $5,280
Federal grants: $5,370
Any grant aid: $6,212
* Full-time, first-time, degree-seeking students
Percent of Students Receiving Aid by Type of Aid* (FY 2024)
Federal loans: 15%
Institutional grants: 20%
State/local grants: 31%
Pell grants: 37%
Federal grants: 37%
Any grant aid: 51%
* Full-time, first-time, degree-seeking students
Student Loan Default Rate %
3-yr Average
FY 2021
FY 2020
FY 2019
1.13%
0.0%
0.0%
3.4%
Graduates
Credentials Awarded by Fiscal Year**
Fiscal Year
Degrees
Certificates
Total
FY 2021
977
326
1,303
FY 2022
995
943
1,938
FY 2023
886
618
1,504
FY 2024
1,096
2,407
3,503
FY 2025
1,038
1,657
2,695
**For Completed Fiscal Years
Graduates by Type of Degree
Type of Degree
FY 2023
FY 2024
FY 2025
Associate in Applied Science
19.8%
9.8%
13.9%
Associate in Arts
26.6%
14.7%
16.8%
Associate in Engineering Science
1.2%
0.3%
1.0%
Associate in General Education
5.2%
2.6%
2.7%
Associate in Science
6.1%
3.9%
4.0%
Certificate, Occupational
25.6.1%
24.9%
39.3%
Certificate, General Education
15.5%
43.8%
22.2%
**For completed Fiscal Years
Top Five Transfer Institutions (four-year or higher)